The ML Workflow
End to End
A friendly, thorough walkthrough of how a machine learning project comes alive — from the first question all the way to a system that learns, predicts, and keeps getting smarter in the real world.
What Is Machine Learning — and Why Does It Matter?
Imagine teaching a dog tricks by giving it treats when it does the right thing. Machine learning works a lot like that — except instead of a dog, it is a computer program, and instead of treats, it gets data.
Machine learning (ML) is a branch of artificial intelligence where computers are not explicitly programmed with step-by-step instructions for every situation. Instead, they are handed large amounts of examples and allowed to figure out the patterns on their own. Over time — and with enough examples — the computer builds an internal understanding that lets it make predictions, recognize images, translate languages, or even beat humans at chess.
Think about how you learned to recognize cats. Nobody handed you a rulebook that said “four legs + pointy ears + whiskers = cat.” You simply saw hundreds of cats, dogs, birds, and other animals as a child, and your brain gradually built a pattern-matching ability. A machine learning model does exactly the same thing — just much, much faster, and with far more examples than any human brain could process.
Machine learning gives computers the ability to learn from experience without being explicitly programmed — turning raw data into insights, predictions, and intelligent decisions.— Core definition, synthesized from leading ML research
Why Is It Such a Big Deal?
Twenty years ago, getting a computer to recognize a handwritten letter required thousands of lines of carefully crafted rules. Today, a machine learning model trained on millions of examples can recognize handwriting, spoken language, facial expressions, and even emotions — all with a level of accuracy that rivals or surpasses humans.
Why Do We Need an End-to-End Workflow?
Building a machine learning model is not a single action. It is more like building a house — you need an architect, a builder, an inspector, and a maintenance team. The ML workflow is the blueprint that makes sure everyone knows what to do and in what order.
Many beginners to machine learning make the mistake of jumping straight into the “cool part” — training a model — without thinking carefully about the quality of their data, the definition of their goal, or how the model will behave once it is released into the real world. This leads to models that work brilliantly in practice sessions but fail spectacularly when they meet real customers.
Imagine trying to bake a pizza without a recipe. You might throw flour, cheese, and random toppings into an oven and hope for the best. Sometimes you get lucky. But a professional pizzeria follows a repeatable process — the same dough recipe, the same oven temperature, the same quality check — every single time. The ML workflow is that professional recipe for building reliable AI systems.
The end-to-end ML workflow exists to solve three major problems that plague ML projects:
- Reproducibility: Without a documented workflow, it becomes impossible to recreate results or trace back what went wrong when a model misbehaves.
- Scalability: A workflow that works for a small dataset must scale up gracefully when the data grows from thousands to millions of examples.
- Reliability: Production systems cannot afford sudden surprises. A structured workflow includes monitoring so that silent failures are caught early.
- Collaboration: Data scientists, engineers, business stakeholders, and operations teams all work on different pieces. A clear workflow ensures they speak the same language and hand off work cleanly.
The Three Pillars of Every ML Project
Every machine learning project — whether it is a spam filter on your email or a self-driving car — rests on the same three pillars: Data, Model, and Code. Remove any one of them and the whole structure collapses.
Data Engineering
Acquiring, cleaning, labelling, and splitting the raw information that the model will learn from. Garbage in, garbage out — this pillar is the most time-consuming, often eating up 60–80% of total project effort.
Model Engineering
Choosing the right learning algorithm, training it on the prepared data, tuning its settings, and rigorously checking whether it actually learned the right thing before shipping it to users.
Code Engineering
Wrapping the finished model into software that can be called by other applications, monitoring its performance over time, and making sure it stays useful as the world changes around it.
Problem Definition — Asking the Right Question
Before a single line of code is written, the most important work is figuring out exactly what problem you are trying to solve. A fuzzy question will always produce a fuzzy answer, no matter how powerful your algorithm is.
Imagine you work for a hospital and your boss says: “Use AI to make our hospital better.” That instruction is too vague to act on. Is the goal to predict which patients will be readmitted? To speed up diagnoses? To cut costs? Each of these problems requires completely different data, different models, and different success criteria. The problem definition phase forces the team to get specific.
What outcome do we want to predict or decide? Why does it matter to the business? Who will use the result? How will we measure success? Where does the necessary data live? Answering all five before building anything separates successful ML projects from failed ones.
Types of ML Problems
Once the business question is clear, we translate it into a specific type of ML task. The most common types are:
Sorting inputs into categories. Is this email spam or not? Is this tumor benign or malignant? Will this customer churn?
Predicting a number. How much will this house sell for? What will the stock price be tomorrow? How many units will we sell next month?
Finding natural groups in data without predefined labels. Group our customers by purchasing behavior so we can market to them differently.
Learning through trial and reward. Train a robot arm, teach an agent to play a video game, or optimise energy usage in a data centre.
Not every problem needs machine learning. If a simple rule or a spreadsheet formula can answer the question reliably, use it. ML shines where the patterns are too complex for humans to write down explicitly, where data is abundant, or where the environment changes over time.
Data Collection — Gathering the Raw Ingredients
If the model is the chef, then data is the food. You cannot cook a great meal with rotten ingredients, no matter how skilled you are. Collecting good data is the single most important investment you can make in an ML project.
Data lives everywhere — inside company databases, in customer transaction logs, on public government websites, in social media posts, on IoT sensors, in satellite imagery, and even in handwritten forms waiting to be digitised. The data collection phase is about identifying which sources are relevant to the problem, gathering data from those sources, and making sure there is enough of it to train a model that generalises well.
The Four Qualities of Good Data
Relevance
The data must actually contain the signal needed to answer the question. Data about the weather is irrelevant for predicting credit card fraud.
Quality
Accuracy, consistency, and ethical sourcing. Data that was measured incorrectly or collected in a biased way will produce a biased model.
Quantity
Enough examples to capture the full range of situations the model will encounter. Simple problems may need thousands; complex ones need millions.
Sometimes real data is scarce, private, or dangerous to collect (think: rare diseases, car crashes). Data scientists can artificially generate realistic fake examples using generative models — this is called synthetic data generation, and it is increasingly common in healthcare, autonomous vehicles, and finance.
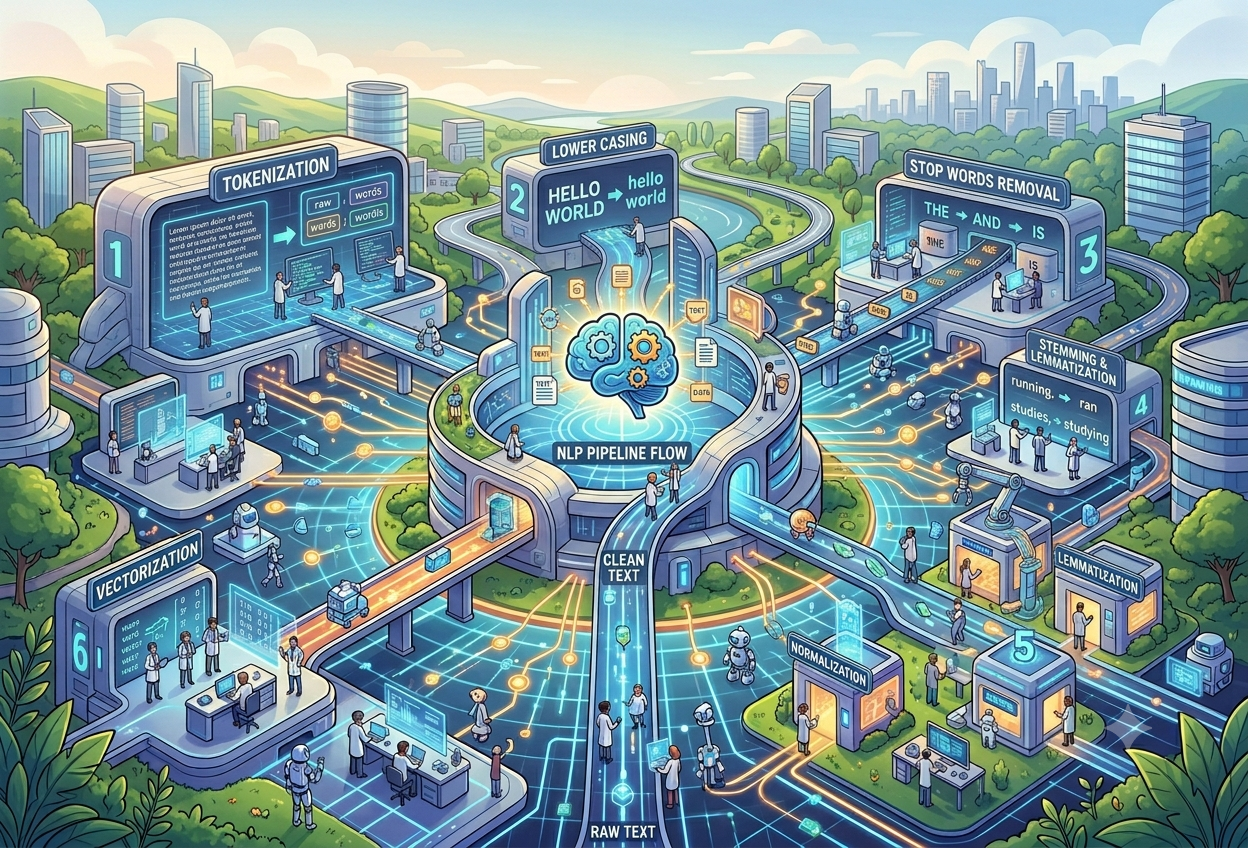
Data Cleaning — Fixing the Messy Stuff
Raw data collected from the real world is almost always messy. Think of it like a bag of vegetables from the market — some are perfect, some are bruised, some are the wrong kind entirely. Before you can cook, you have to sort, clean, and prepare them.
Data cleaning (also called data wrangling or data preprocessing) is the process of identifying and correcting problems in a dataset before handing it to a machine learning algorithm. It is widely reported to consume more than half of a typical data scientist’s working time — which is a striking reminder that the creative work of building models is only possible once the unglamorous work of fixing data is done.
Key Cleaning Operations
- Missing Value Imputation: When some entries have no recorded value, we either remove those rows or fill in a reasonable estimate (such as the average or the most common value for that column).
- Duplicate Removal: Identical or near-identical rows skew results by making certain examples appear more common than they really are.
- Outlier Handling: Extreme values (a person listed as 500 years old, for instance) can pull a model’s parameters in entirely the wrong direction. We identify and either remove or cap these values.
- Format Standardisation: Dates, currencies, units of measurement, and categorical labels all need to be in a single consistent format across the entire dataset.
- Data Labelling: For supervised learning tasks, each example needs a correct answer attached. A photo of a cat must be labelled “cat.” This labelling work is often done by human annotators and can be extremely time-consuming.
- Train/Validation/Test Splitting: The cleaned dataset is divided into three portions — one for training (typically 70%), one for validating choices during training (15%), and one held back entirely for the final test (15%).
Exploratory Data Analysis — Getting to Know Your Data
Before building anything, a good data scientist takes time to simply explore and listen to the data. What stories does it tell? What surprises does it contain? This detective work — called Exploratory Data Analysis, or EDA — often uncovers insights that completely change the direction of a project.
EDA uses statistics and visual charts to help humans understand the shape, spread, and patterns within a dataset. It is the phase where you discover that 80% of your sales come from 20% of your customers, that purchase rates spike every Friday evening, or that one of your most important variables is nearly identical to another one and therefore redundant.
Common EDA Techniques
Histograms
Show how values are distributed. Is age spread evenly, or are most users between 25 and 34? Are there unexpected gaps or spikes?
Correlation Heatmaps
Reveal which variables move together. If two features are highly correlated, keeping both is redundant and can confuse the model.
Box Plots
Expose outliers and the spread of data at a glance. A long “whisker” on a box plot is a signal that something unusual lives in that column.
In one famous data science competition, a team spent two weeks building increasingly complex models and barely moved the accuracy needle. Then a junior analyst spent an afternoon on EDA and discovered that one feature — the day of the week — completely explained 40% of the target variable. Ten minutes of plotting saved weeks of modelling.
Feature Engineering — Helping the Model See Better
A feature is simply a variable — one piece of information the model can use to make a prediction. Feature engineering is the creative art of deciding which variables to keep, which to transform, and which new ones to invent by combining existing ones.
Think of it this way: a raw timestamp (e.g., “2024-03-15 14:32:00”) is not very informative on its own. But if you engineer new features from it — “day of week = Friday”, “hour = 14”, “is_weekend = No”, “days_until_month_end = 16” — you give the model far more useful handles for making predictions about user behaviour.
Feature Transformation
Converting raw values into a form that machine learning algorithms find easier to work with. Taking the logarithm of a skewed variable, for example, can dramatically improve model performance.
Feature Creation
Combining two or more existing columns into a brand-new, more informative variable. “Revenue per customer” is more useful than “total revenue” and “customer count” separately.
Feature Selection
Identifying which features genuinely help the model and removing the rest. Too many irrelevant features add noise, slow training, and cause overfitting.
Dimensionality Reduction
When there are hundreds or thousands of features, techniques like PCA compress them into a smaller set of “super-features” that capture most of the important variation.
In machine learning, coming up with features is difficult, time-consuming, and requires expert knowledge. Applied ML is basically feature engineering.
— Andrew Ng, AI PioneerModel Selection — Choosing the Right Algorithm
Choosing a model is like choosing a vehicle for a trip. A racing car is fast on a motorway but useless off-road. A tractor crosses muddy fields but crawls on highways. The right algorithm depends entirely on the nature of your problem, your data, and what you are willing to trade off.
Dozens of machine learning algorithms exist, each with different strengths. Some are simple and explainable (great for regulated industries like banking or healthcare). Others are enormously powerful but behave like black boxes (useful when raw accuracy is paramount and explainability is secondary).
| Algorithm | Best For | Strength | Weakness |
|---|---|---|---|
| Linear Regression | Predicting numbers | Simple, fast, explainable | Only captures linear patterns |
| Logistic Regression | Binary classification | Probability outputs, interpretable | Weak on complex non-linear data |
| Decision Tree | Structured / tabular data | Very easy to visualise and explain | Overfits easily |
| Random Forest | Most tabular problems | Robust, handles noise well | Slower, less interpretable than single trees |
| Gradient Boosting (XGBoost) | Competition-level accuracy | State-of-the-art on tabular data | Needs careful tuning |
| Neural Networks | Images, audio, text | Learns complex patterns automatically | Needs huge data and compute |
| K-Means Clustering | Grouping unlabelled data | Fast, simple to understand | Sensitive to scale; must pre-specify K |
| SVM | Small datasets, text | Effective in high dimensions | Slow on large data; black box kernel |
There is no single best algorithm for every problem. The standard practice is to start with simpler models (logistic regression, decision tree), establish a performance baseline, and then try progressively more complex algorithms to see whether the additional complexity is worth the trade-off in interpretability and compute cost.
Model Training — Teaching the Machine
Model training is the moment when the machine actually learns. Data goes in, the algorithm finds patterns, and a model — a mathematical function — comes out. But the process is much more than just pressing a “learn” button.
During training, the model makes predictions on the training data, compares them to the known correct answers, calculates how wrong it was (the “loss”), and adjusts its internal parameters slightly to be less wrong next time. This loop runs thousands or millions of times until the model’s predictions stop improving significantly.
Key Concepts in Model Training
Hyperparameters
These are the settings you choose before training begins — like the learning rate, the depth of a decision tree, or the number of neurons in a neural network. Unlike the model’s internal weights (which it learns automatically), hyperparameters are set by the engineer and significantly impact the final result.
Overfitting vs Underfitting
Overfitting happens when a model memorises the training data so perfectly that it fails on new examples — like a student who memorises answers without understanding the material. Underfitting happens when the model is too simple to capture the patterns at all. The goal is a model that generalises: it performs well on training data AND on new, unseen examples.
Cross-Validation
Instead of using a single fixed train/test split, cross-validation rotates which portion of data is used for validation across multiple rounds. This gives a more reliable estimate of how well the model will generalise and reduces the risk of accidentally picking a split that gives an overly optimistic score.
Evaluation & Tuning — Is It Good Enough?
Training a model is easy. Knowing whether it is actually any good — and good enough for real-world use — is hard. Evaluation is the phase where we stress-test the model against data it has never seen before and measure its performance on metrics that actually matter to the business.
A common mistake for beginners is to use accuracy as the only evaluation metric. But accuracy can be deeply misleading. If 99% of emails are not spam, a model that labels everything “not spam” achieves 99% accuracy — yet it is completely useless because it catches zero spam. Better metrics account for the types of mistakes the model makes.
| Metric | What It Measures | Best Used When |
|---|---|---|
| Accuracy | Overall % of correct predictions | Classes are roughly balanced |
| Precision | Of all positive predictions, how many were correct? | False positives are costly (spam filters) |
| Recall | Of all actual positives, how many did the model find? | False negatives are costly (cancer detection) |
| F1 Score | Harmonic mean of Precision and Recall | Imbalanced classes |
| AUC-ROC | Overall ability to distinguish classes | Comparing models at any threshold |
| MAE / RMSE | Average prediction error size (regression) | Predicting continuous values |
Hyperparameter Tuning Methods
Grid Search
Try every possible combination of hyperparameter values from a predefined list. Thorough but can be very slow for large search spaces.
Random Search
Sample random combinations from the parameter space. Often finds good results faster than Grid Search at a fraction of the computational cost.
Bayesian Optimisation
Uses past evaluation results to intelligently choose which combination to try next. Much more efficient than random or exhaustive search.
Model Deployment — Releasing the Model into the World
A machine learning model that lives only on a data scientist’s laptop is like a recipe that nobody ever cooks. Deployment is the act of taking the trained model and making it available to the users and systems that need it — whether that is a customer-facing app, an internal dashboard, or an automated decision system.
Deployment is widely considered the hardest part of the ML lifecycle. It is where data science meets software engineering, and where many well-intentioned projects grind to a halt. The model needs to be packaged, containerised, served via an API, integrated with existing software, tested at scale, and given a safe rollout strategy.
Deployment Formats
- REST API: The model is wrapped in a web service. Other applications send it data via HTTP requests and receive predictions back in JSON. This is the most common deployment pattern.
- Batch Inference: The model processes large datasets periodically (nightly, weekly) rather than in real time. Suitable for generating recommendations, risk scores, or reports on a schedule.
- On-Device / Edge Deployment: The model runs directly on a smartphone, smart speaker, or industrial sensor — no internet required. This is essential when latency, privacy, or connectivity is a concern.
- Model Packaging (ONNX / PMML): Standard formats allow models trained in one framework (TensorFlow) to be deployed in a different environment (a Java application) without re-training.
Monitoring & Maintenance — Keeping the Model Healthy
Deploying a model is not the finish line — it is the starting line. The real world is messy and constantly changing. A model trained on last year’s data will gradually become less accurate as customer behaviour shifts, product lines change, and new patterns emerge. Monitoring is how you notice this happening before your users do.
The phenomenon where a model’s real-world performance degrades over time is known as model drift. There are two main types: data drift (the distribution of input features changes) and concept drift (the relationship between inputs and the correct output changes). Both are normal and expected — the key is detecting them early and responding with targeted retraining.
Continuously measure real-world accuracy, precision, recall, or business KPIs — not just the scores from the original test set.
Set thresholds. If accuracy drops below X% or prediction latency exceeds Y milliseconds, automatically page the on-call engineer.
Every prediction request and its result is stored. This audit trail is invaluable for debugging strange model behaviour months later.
Automated pipelines kick off model retraining when performance metrics fall below defined thresholds, keeping the model fresh.
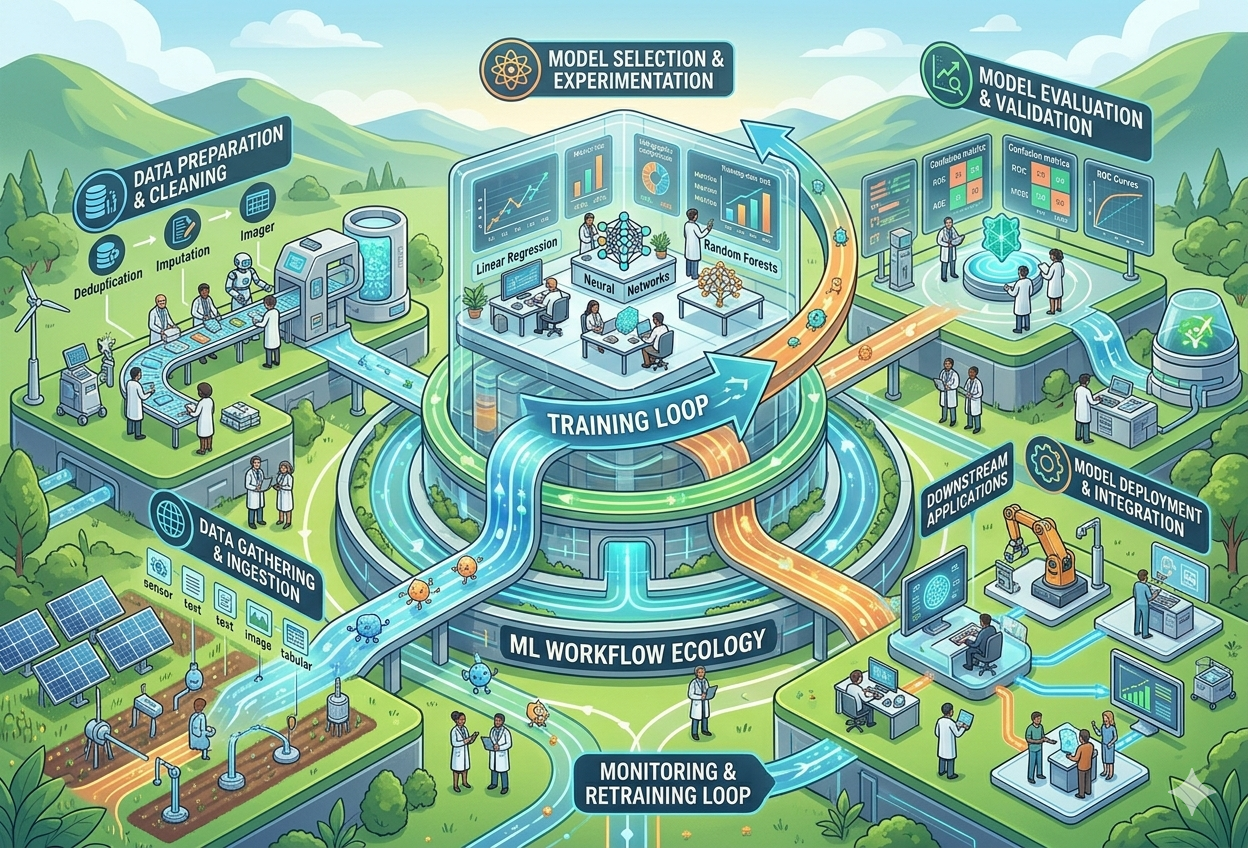
The ML Pipeline — Automating the Whole Journey
Running all ten phases manually every time you need to update a model is slow, error-prone, and unscalable. An ML pipeline stitches all these steps together into an automated, repeatable assembly line.
Think of a factory production line. At one end, raw steel and rubber go in. At the other end, a finished car rolls out. Every step in between — cutting, welding, painting, assembly, testing — happens in the same order, using the same tools, every single time. An ML pipeline works the same way: raw data goes in one end, and a tested, deployed model comes out the other, with every intermediate step automated and logged.
Why Pipelines Are Non-Negotiable in Production
Without a pipeline, every model update requires a data scientist to manually re-run dozens of scripts in the correct order, remember to apply the same preprocessing steps, and hope nothing goes wrong. With a pipeline, a single trigger (a scheduled job, a new data batch, a dropped metric) kicks off the entire sequence automatically, end-to-end, with full logging at every step.
Automation reduces human error. Reproducibility ensures the same input always produces the same output. Scalability means the pipeline can handle ten times the data with minimal changes. Auditability gives regulators and quality teams a complete record of every step.
MLOps — The Discipline That Makes It All Work
MLOps (Machine Learning Operations) is the set of practices, tools, and cultural norms that bridges the gap between building ML models and keeping them running reliably in production. It is to machine learning what DevOps is to regular software development.
Building a model in a Jupyter notebook is something many people can do. Keeping dozens of models running in production at scale — all while safely updating them, tracking their performance, managing data versions, and rolling back bad releases — requires an entirely different discipline. That discipline is MLOps.
Google’s Four ML Development Phases
1
Ideation & Planning
Define the business problem, verify that ML is the right solution, estimate feasibility, and produce a design document. This phase ends with a clear answer to the question: “Should we build this at all?”
2
Experimentation
Try hundreds of combinations of features, hyperparameters, and model architectures to find a configuration that solves the problem well enough to be worth productionising. This phase is deliberately messy and iterative.
3
Pipeline Building
Translate the winning experimental configuration into a robust, automated, and reproducible pipeline capable of running on production-grade infrastructure at scale.
4
Productionisation
Deploy the pipeline, set up monitoring and alerting, handle the edge cases and failure modes that only appear at real-world scale, and create the operational playbook for ongoing maintenance.
Pros, Cons & Common Challenges
Like any powerful tool, the ML workflow is not magic. Understanding its genuine strengths alongside its real limitations is what separates thoughtful practitioners from people who throw neural networks at every problem and wonder why the results disappoint.
✓ Advantages
- Handles complexity that explicit rules cannot capture
- Improves automatically as more data becomes available
- Scales to billions of inputs with consistent quality
- Discovers patterns invisible to human analysts
- Automates repetitive, time-consuming decisions
- Adapts to new inputs with retraining (no re-programming)
- Works across vastly different domains (text, images, signals)
✗ Disadvantages
- Requires large amounts of high-quality labelled data
- Models can encode and amplify historical biases
- Complex models are difficult to explain or audit
- High computational cost for training and inference
- Brittle: performance can collapse on out-of-distribution data
- Maintenance burden: models need continuous monitoring
- Security vulnerabilities: susceptible to adversarial attacks
The Top Reasons ML Projects Fail
The Data Problem
Insufficient data, mislabelled data, or data that reflects historical biases. A model is only as good as what it learned from.
Misaligned Success Metrics
Optimising for the wrong thing. A model that maximises click-through rates may simultaneously cause users to feel deceived — high technical success, low business success.
Deployment Complexity
The model works perfectly on a laptop but crashes in production due to missing infrastructure, latency requirements, or integration issues with legacy systems.
Lack of Stakeholder Buy-In
Business leaders who do not trust or understand the model’s recommendations revert to manual decisions, nullifying the entire investment.
Where the ML Workflow Lives in the Real World
The same ten-phase workflow that powers a spam filter for your inbox also powers the recommendation engine on a streaming platform, the fraud detection system at a bank, and the route optimisation engine inside a delivery app. The patterns are universal; only the data and business context change.
Healthcare
ML models analyse medical scans to flag potential tumours, predict patient readmission risk, and identify the most effective treatment protocols — often outperforming experienced specialists on specific narrow tasks.
Finance
Real-time fraud detection models process thousands of transactions per second, assigning a risk score to each one. Loan approval models evaluate creditworthiness based on hundreds of variables simultaneously.
Retail & E-commerce
Recommendation engines personalise what each user sees based on their browsing and purchase history. Demand forecasting models ensure the right products are in the right warehouses before a major sale event.
Autonomous Vehicles
Self-driving systems fuse sensor data from cameras, LIDAR, and radar in real time, running object detection, path planning, and speed control models simultaneously at millisecond latency.
Agriculture
Satellite imagery combined with soil sensor data feeds crop yield prediction models that help farmers decide when and where to irrigate, fertilise, or harvest — saving water and maximising output.
Entertainment
Music and video platforms use collaborative filtering models to understand your taste and predict which new song or show you will enjoy — keeping you engaged and helping new creators reach the right audience.
Popular Tools & Technologies Across the ML Workflow
Every phase of the ML workflow has its own ecosystem of tools and frameworks. Knowing which tool to reach for — and why — saves weeks of wheel-reinvention and helps teams work together more effectively.
| Phase | Popular Tools | What They Do |
|---|---|---|
| Data Collection | Apache Spark, Kafka, Airbyte | Ingest and stream large volumes of data from many sources |
| Data Cleaning | Pandas, dbt, Great Expectations | Transform, validate, and test data quality at scale |
| EDA | Matplotlib, Seaborn, Plotly, Tableau | Visualise distributions, correlations, and outliers |
| Feature Engineering | Scikit-learn, Featuretools | Transform, scale, encode, and select features automatically |
| Model Training | TensorFlow, PyTorch, XGBoost, LightGBM | Define and train ML and deep learning models |
| Experiment Tracking | MLflow, Weights & Biases, Neptune | Log experiments, compare runs, track hyperparameters |
| Deployment | FastAPI, TorchServe, BentoML, Seldon | Serve models as APIs with versioning and scaling |
| Orchestration | Airflow, Prefect, Kubeflow, Metaflow | Schedule and orchestrate multi-step ML pipelines |
| Monitoring | Prometheus, Grafana, Evidently AI, Arize | Track model performance and detect data/concept drift |
| Cloud Platforms | AWS SageMaker, GCP Vertex AI, Azure ML | End-to-end managed ML services at cloud scale |
Key Terms Glossary
A quick reference for the most important vocabulary in the ML workflow.
| Term | Plain-English Definition |
|---|---|
| Algorithm | A set of rules or steps a computer follows to learn patterns from data |
| Batch Inference | Running predictions on many examples at once, rather than one at a time in real time |
| Concept Drift | When the real-world relationship between input features and the target changes over time |
| Cross-Validation | A technique to reliably estimate model performance by rotating which data is used for testing |
| Data Drift | When the statistical distribution of input features changes compared to when the model was trained |
| EDA | Exploratory Data Analysis — using charts and statistics to understand a dataset before modelling |
| Feature | A single measurable property of the data used as input to a model (e.g., age, zip code, pixel brightness) |
| Hyperparameter | A setting that controls how the model learns, chosen before training begins (e.g., learning rate) |
| Inference | Using a trained model to make a prediction on new data |
| Label | The correct answer attached to a training example (e.g., “spam” or “not spam”) |
| Loss Function | A mathematical measure of how wrong the model’s predictions are; training tries to minimise this |
| Model | The mathematical function learned from data that transforms inputs into predictions |
| MLOps | Practices and tools for reliably deploying, monitoring, and maintaining ML models in production |
| Overfitting | When a model learns training data too perfectly and fails to generalise to new examples |
| Pipeline | An automated, end-to-end sequence of steps that transforms raw data into a deployed model |
| Training Data | The subset of data used to teach the model; it sees this data during the learning process |
| Validation Data | A separate subset used to tune hyperparameters and make modelling decisions during training |
| Test Data | A held-out subset the model never sees until the very final evaluation; the true measure of performance |
| Weight | An internal parameter of a model that is automatically adjusted during training to minimise loss |
Sources & Further Reading
This document was synthesised from the following primary references, supplemented with additional research from peer-reviewed papers and industry practice guidelines.
Comprehensive overview of the three engineering phases and their constituent operations, published under CC BY 4.0.
Detailed breakdown of the ten-step ML lifecycle from problem definition to ongoing monitoring and maintenance.
IBM’s definitive explainer on pipeline architecture, automation benefits, and enterprise deployment patterns.
Practical guide to building pipelines in Python using Scikit-learn, with emphasis on automation and scalability.
Google’s framework for managing ML projects through four iterative phases from ideation to productionisation.
Technical reference for building ML pipelines in Python using the industry-standard scikit-learn library.